Various industries, various staff roles, but one thing is for certain: having the right number and profile of staff workers in your store will help increase sales KPIs: conversion, average sell price and average units per transaction.
Good staff optimization helps solve the problem of staff idle times and overstaffing which reduces operational costs and increases profitability.
There are times when we enter a store and feel overwhelmed by the amount of staffers attention and there are other times where we just can't find anyone in the store who can help us. Both cases lead to shopper frustration, broken experiences and less profit.
Staffers are the oil of your store engine and an essential component in creating a seamless shopper journey.
Let's look at how StoreDNA enables you to run that engine at full speed.
Staff optimization use-case
We have installed the StoreDNA platform and got access to the Actionboard.
Our company is reporting a drop in conversion in the London store for the month of June and we think the cause might be bad staff hour optimization.
We login into the system and look at daily footfall for the month of June.
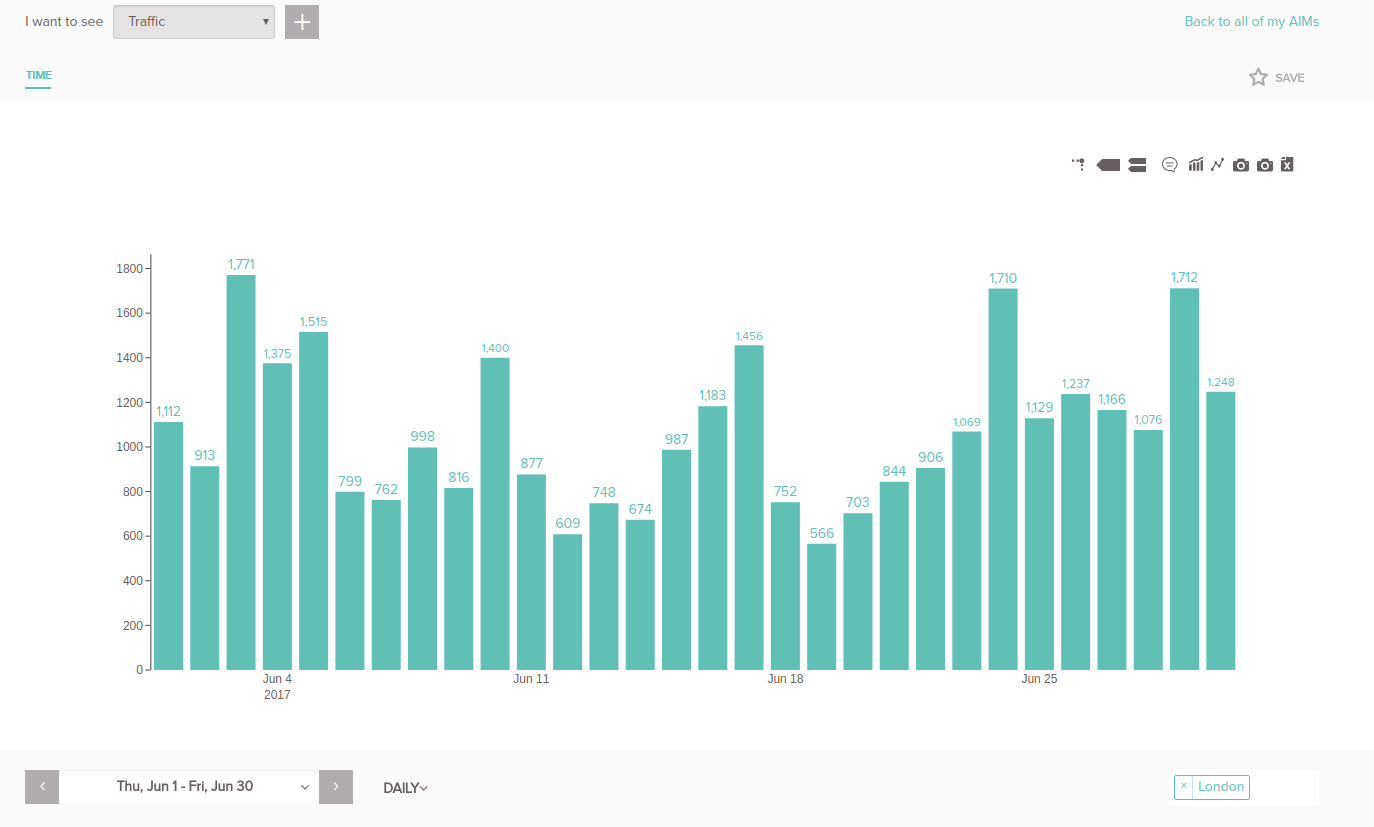
This is simple data reporting, not very useful.
The good thing is the StoreDNA system integrates seamlessly with your POS and workhours data, so we can add more useful metrics to our view.
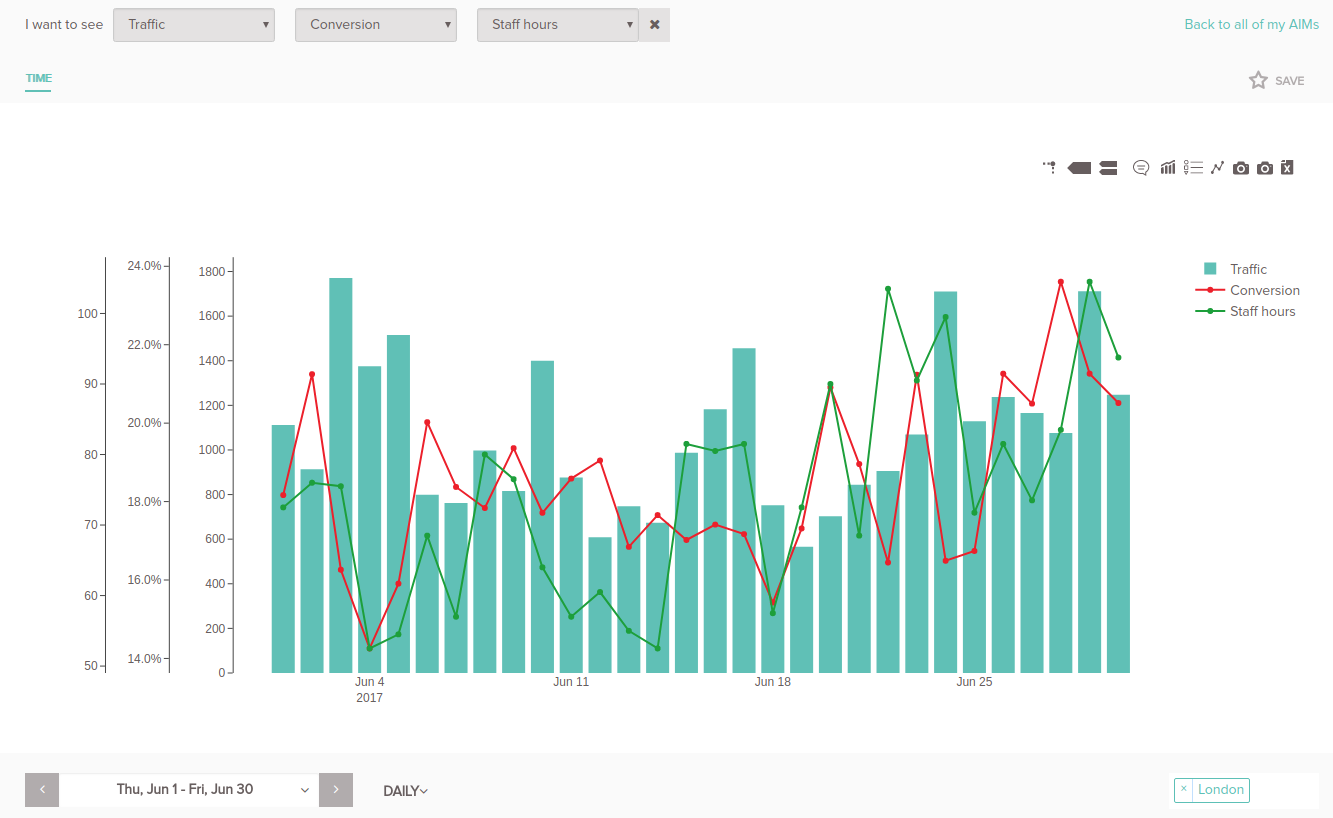
We added metrics conversion and staff hours and we start to notice some patterns for days which need more staff hours to meet rising traffic demands. This is useful but it's easy to get lost in all this data, we must simplify further.
When we combine traffic and staff hours we get a new metric: staff time per visitor. Staff time per visitor shows how much time a staffer is available to help visitors.
Equipped with this new metric we look back at our graph and ask ourselves:
how do we locate the days in which conversion is lower than usual and see how this relates to staff time per visitor?
Fortunately, in the StoreDNA platform, we can group the values by weekday and we get the following AIM (actionable insight map):
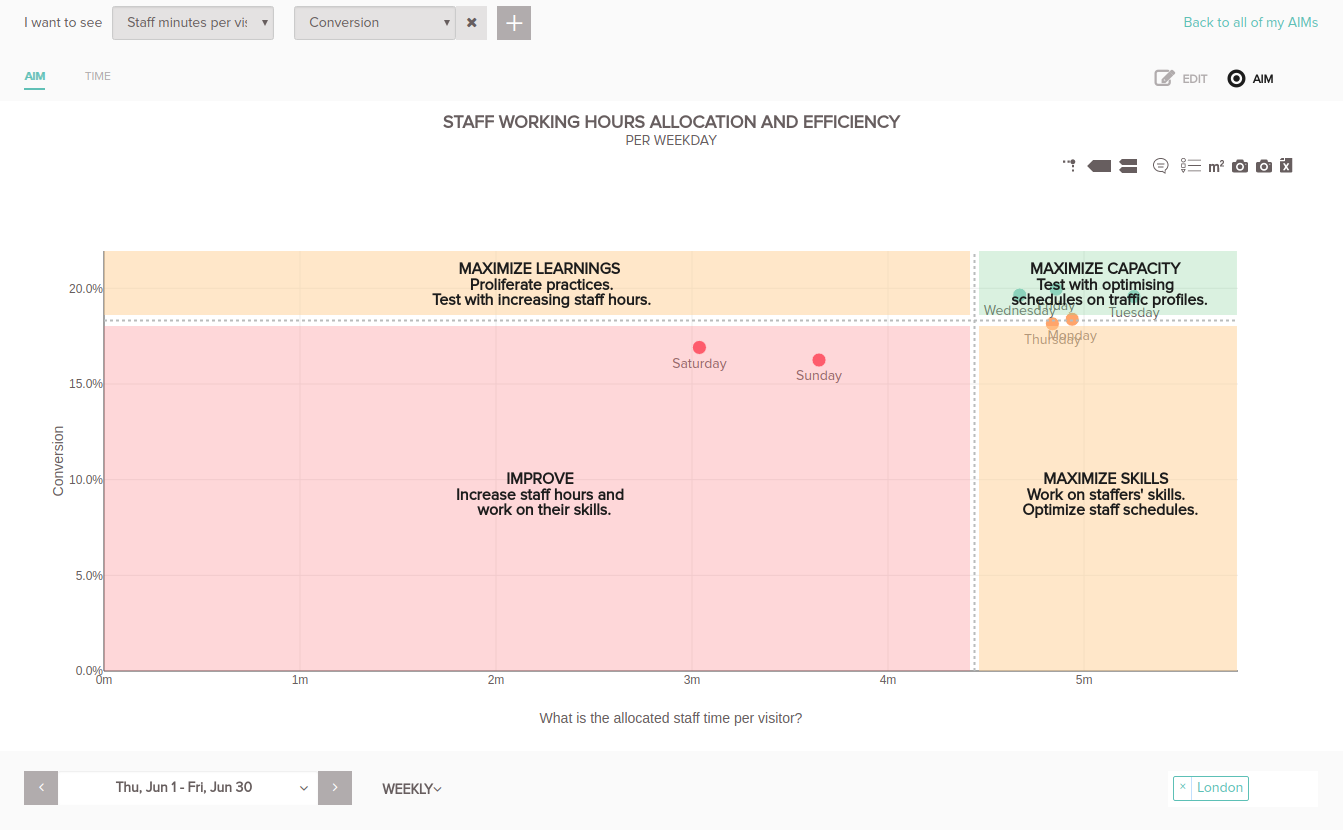
At first glance, it is immediately obvious that something is not quite right with the conversion on Saturday and Sunday. Then, we look at the allocated staff time per visitor and see that it is about 3 minutes per visitor, while on the other days it is closer to 5 minutes.
We use this conclusion and decide to take an action, an experiment, of reallocating some staff hours from Tuesday to Sunday.
In the platform, we can create an action, select the metrics and the time period and name our action. We will do that for our case and after a month of experimenting we get the following result:

The platform automatically compares the period before and after the action and gives us the result of the action.
In this way, we can see which actions work and which ones do not and use the ones which do across our whole fleet of stores.
Let's get back to our example. We correctly moved staff hours from Tuesday to Sunday, but how did we know in which parts of the day we needed more staff service?
For this, we will use the hourly aggregation for a specific day. This gives us the average hourly values for all the Sundays in June.
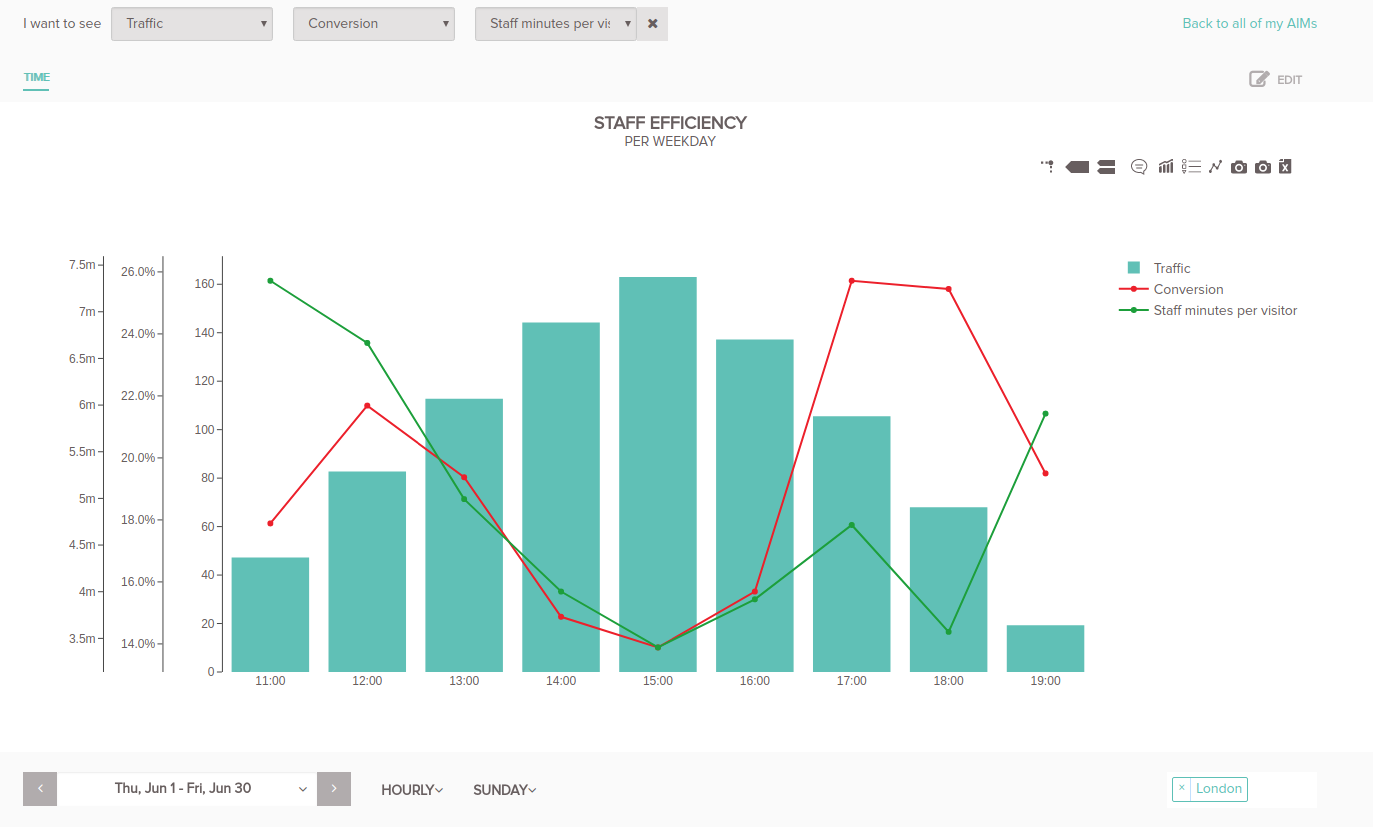
In the graph, we can see a clear dip in both conversion and staff minutes per visitor at the busiest time of the day.
So, this is the period of day in which we need additional staff help.
Scaling our learnings
We have successfully solved the problem we had in London, but what is the situation with our other stores?
All the granularity levels, from weekly to minute and from fleet to sku are easily accessible in the StoreDNA system and can be used to gain insights and test actions.
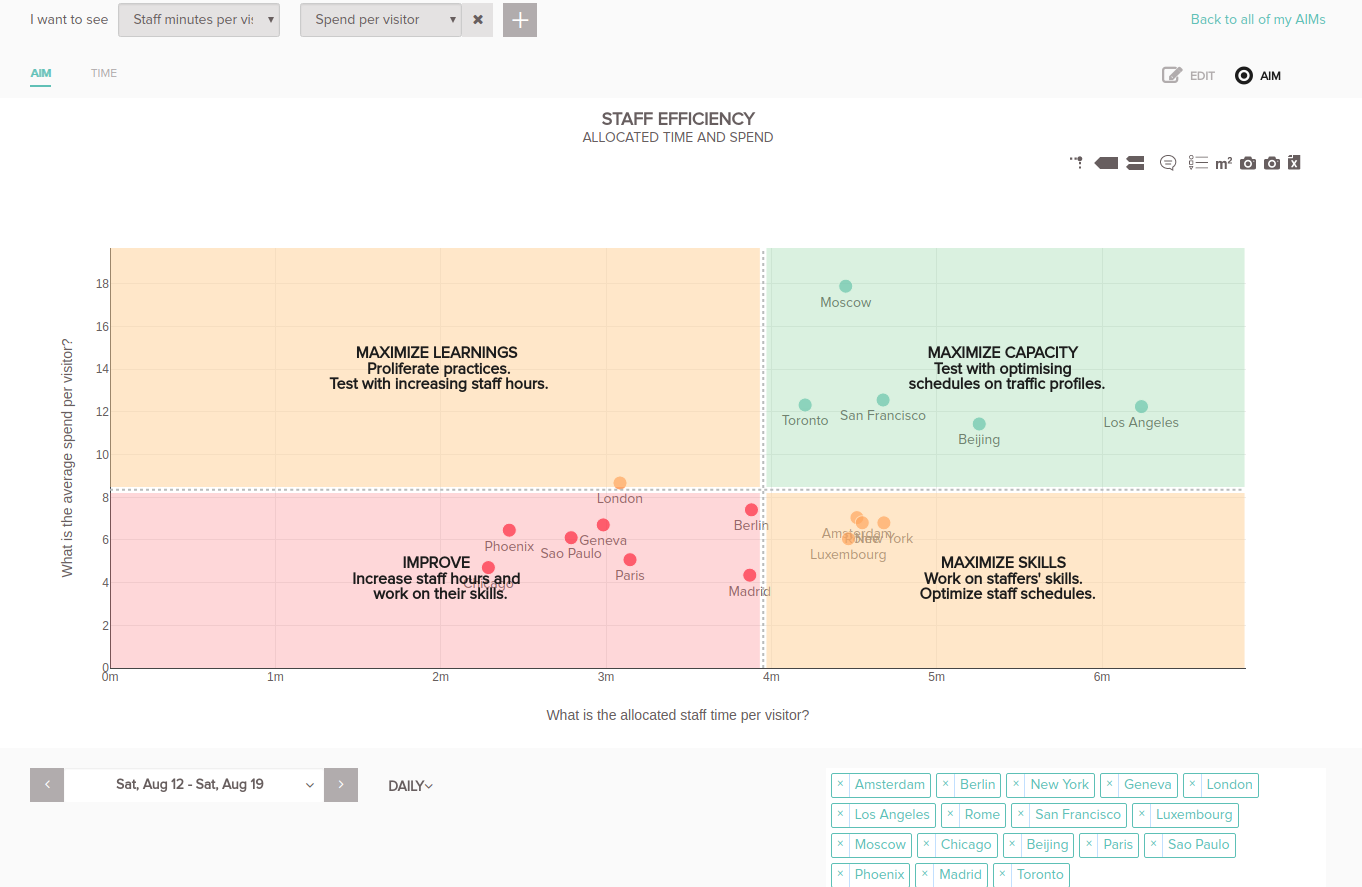
Our last example shows the performance of our staff workers in different stores in our fleet.
If you are interested in optimizing your own stores contact us at grow@storedna.co and get a free demo.