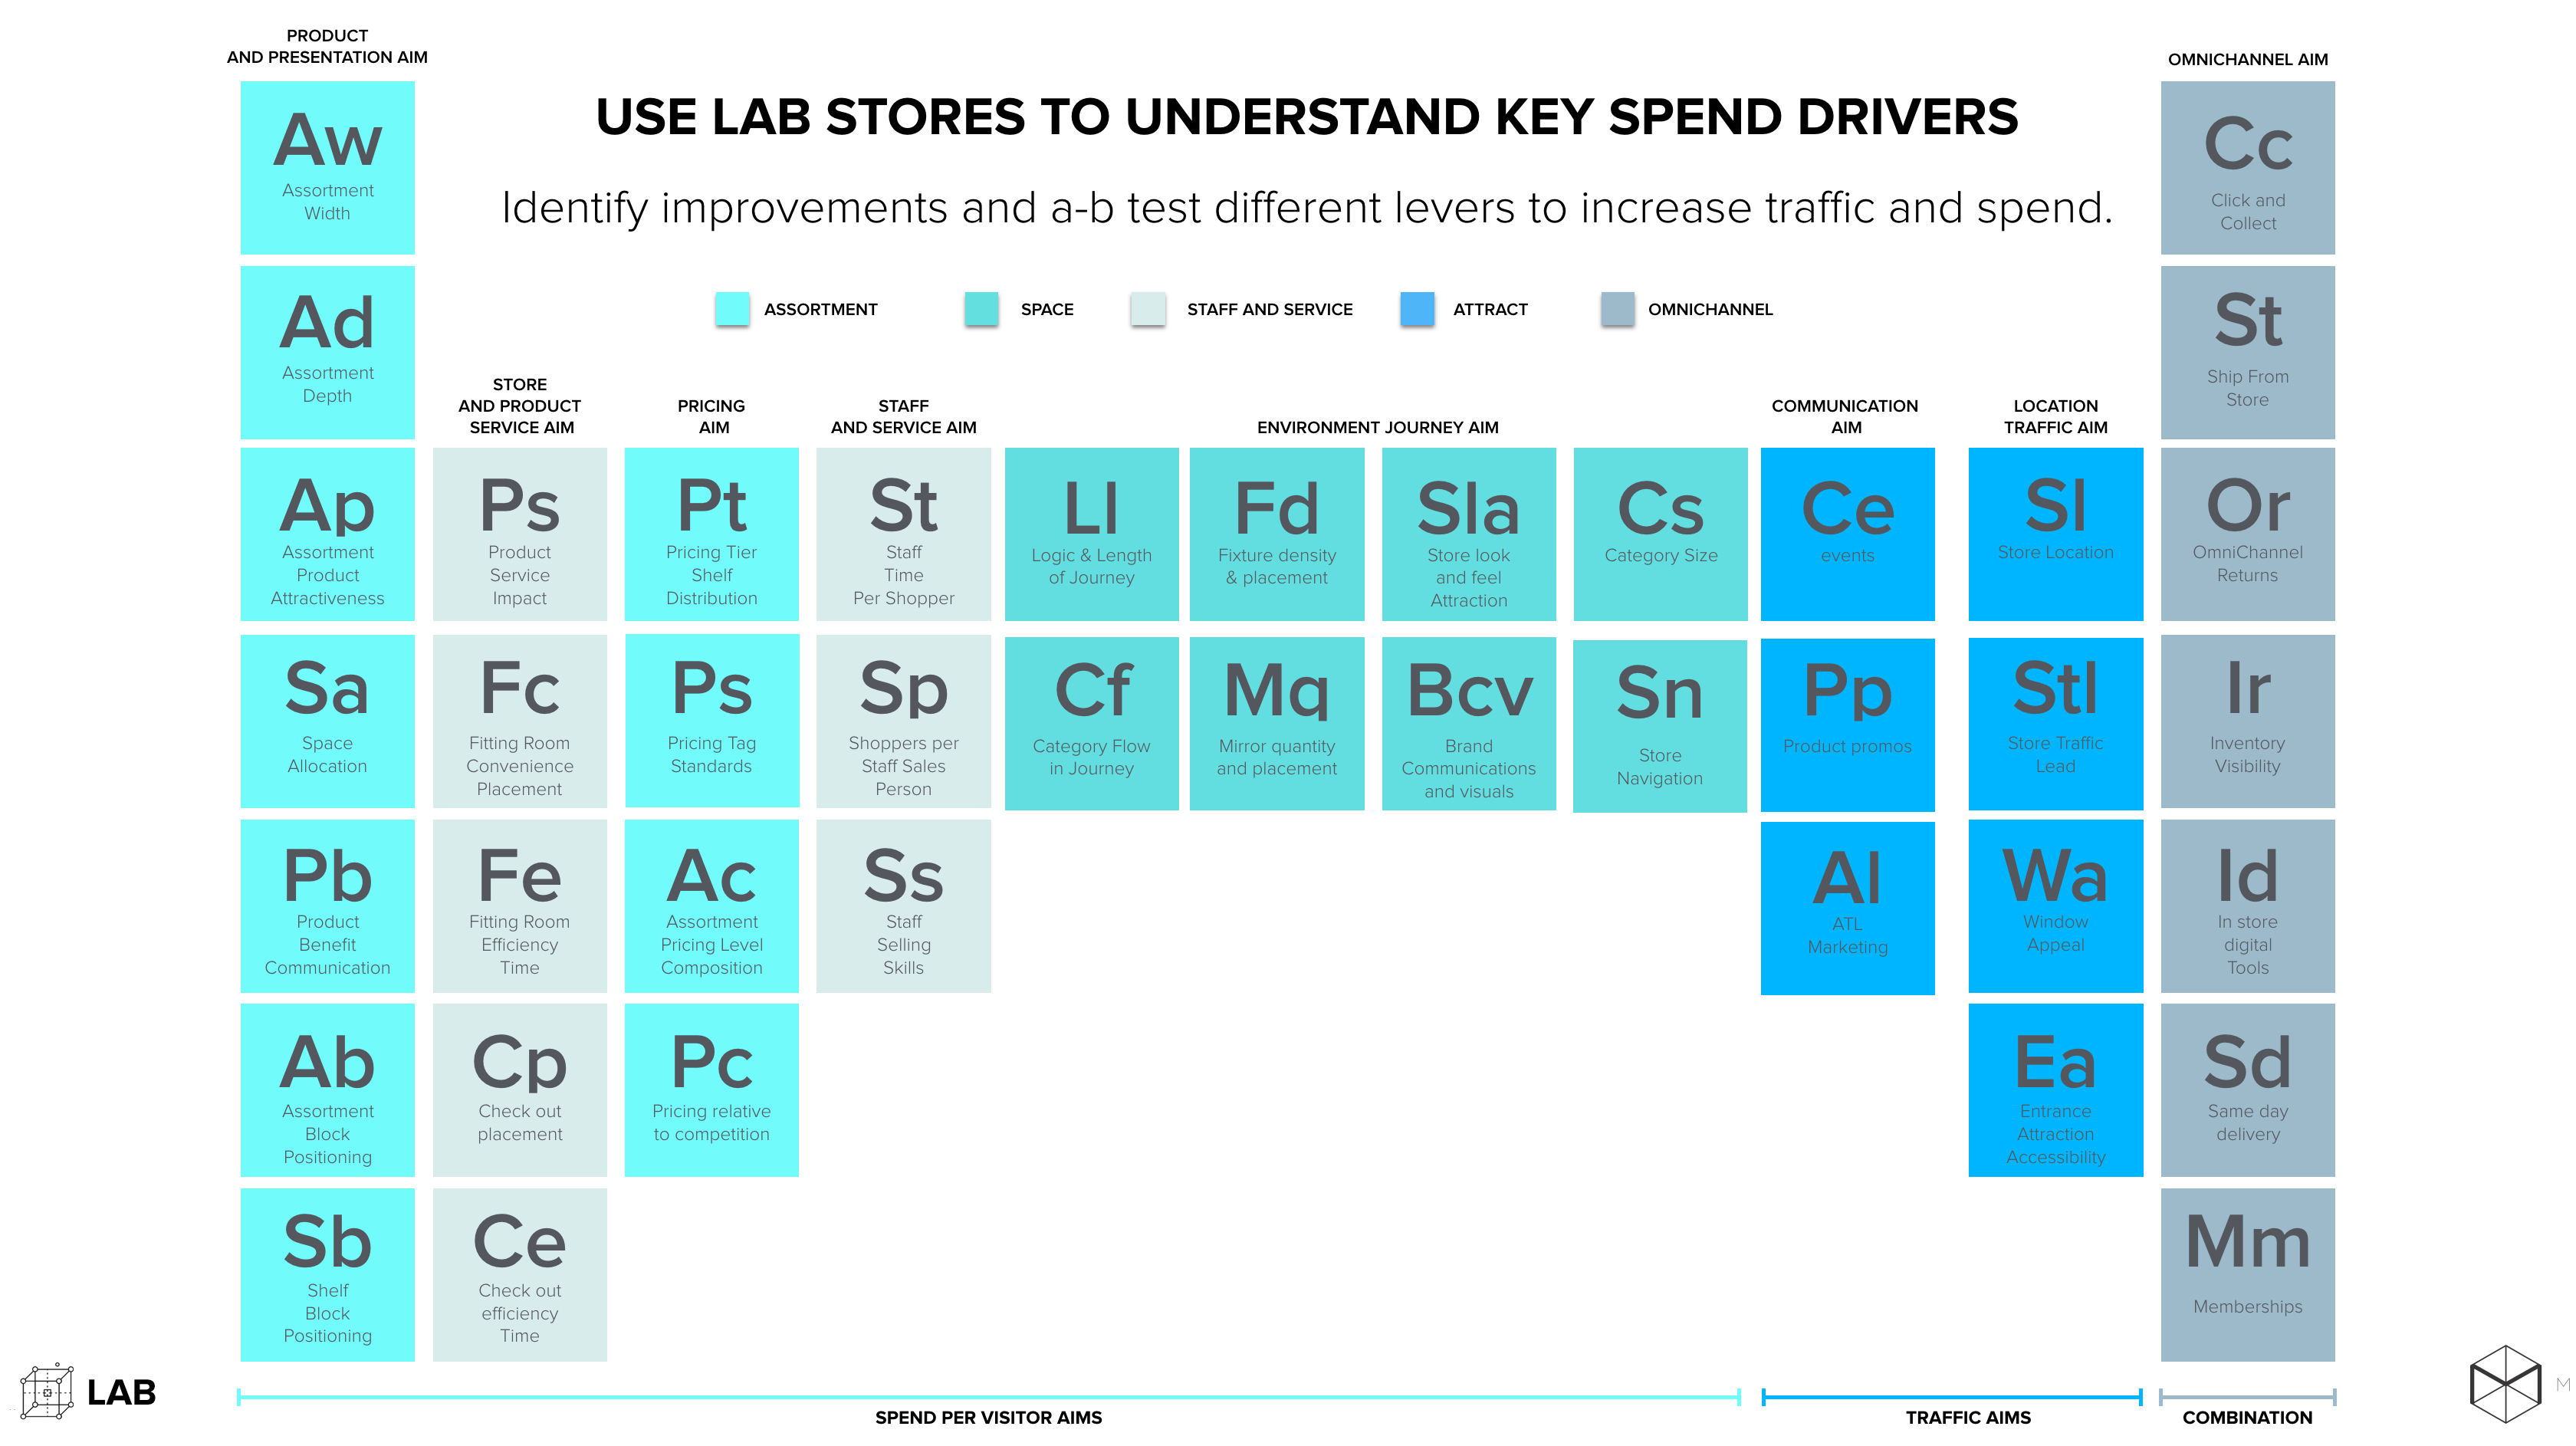
Periodic system of retail performance elements (Actionable Insights Maps)
There are many definitions of shopping. The most common description says that Shopping is an activity in which a customer browses the available goods or services presented by one or more retailers with the intent to purchase a suitable selection of them. In some contexts, it may be considered a leisure activity as well as an economic one.
At Monolith, we believe in the notion that the shopping is the clash between the shopper’s and retailer’s resources. When you enter the store as a shopper, you mostly have two resources at hand: time and money. On the other hand, retail has three critical resources at their disposal: space, assortment and staff. When the retailer has the great assortment, presented in a meaningful way in the space and supported by knowledgeable staff they could mostly use the resources the shopper: time and money.
When we start optimisation journey with our retail customers, we often begin with the model we call Periodic system of retail performance elements. These are the nobs that retailer can turn in the area of staff, assortment and space to optimise shopping experience, and in turn, increase the profitability. Every element represents an Actionable Insight Map (AIM), a robust matrix which acts as a decision making support tool in the everyday retail operations.
The experimentation culture is strong in the online businesses, where Google has anecdotally tested 1000 shades of blue for New Email link in Gmail, Booking.com conducts 50 experiment per day, and every other online retailer uses A-B testing for their online stores. The question is, why we are not performing tests in our offline stores, where we still have the majority of the revenues and where we have one-on-one interactions with our customers. Retailers will often say that there is no precise measurement technology which provides them with the clear view of the outcome of the tests and sometimes it is not that easy to establish an accurate “lab” experiment due to many different drivers of the results. However, we do believe that it is crucial to test the critical drivers of spend and consumer satisfaction and that there is a way which could drive more fact-based decision making when it comes to significant decisions on store design, assortment and workforce planning.
This is why we have designed the periodic system (AIM), to enable retailers to have an overview of key spend and traffic drivers and to learn how to turn the nobs in favour of the better store experience. The first step to diagnose which optimisation technique we need to deploy is to plot the whole fleet on the basic Profitability drivers which are 1) Traffic per SQM and 2) Spend per visitor. Imagine traffic as the Fuel of the fleet, and Spend as the Fire. Once we have this actionable insight map (AIM), we could start optimising Traffic for the stores which have good Spend per visitor but lack traffic and the other way around. Fuel vs Fire Map gives us the best indication on how to approach different clusters of stores and which elements should we test first.
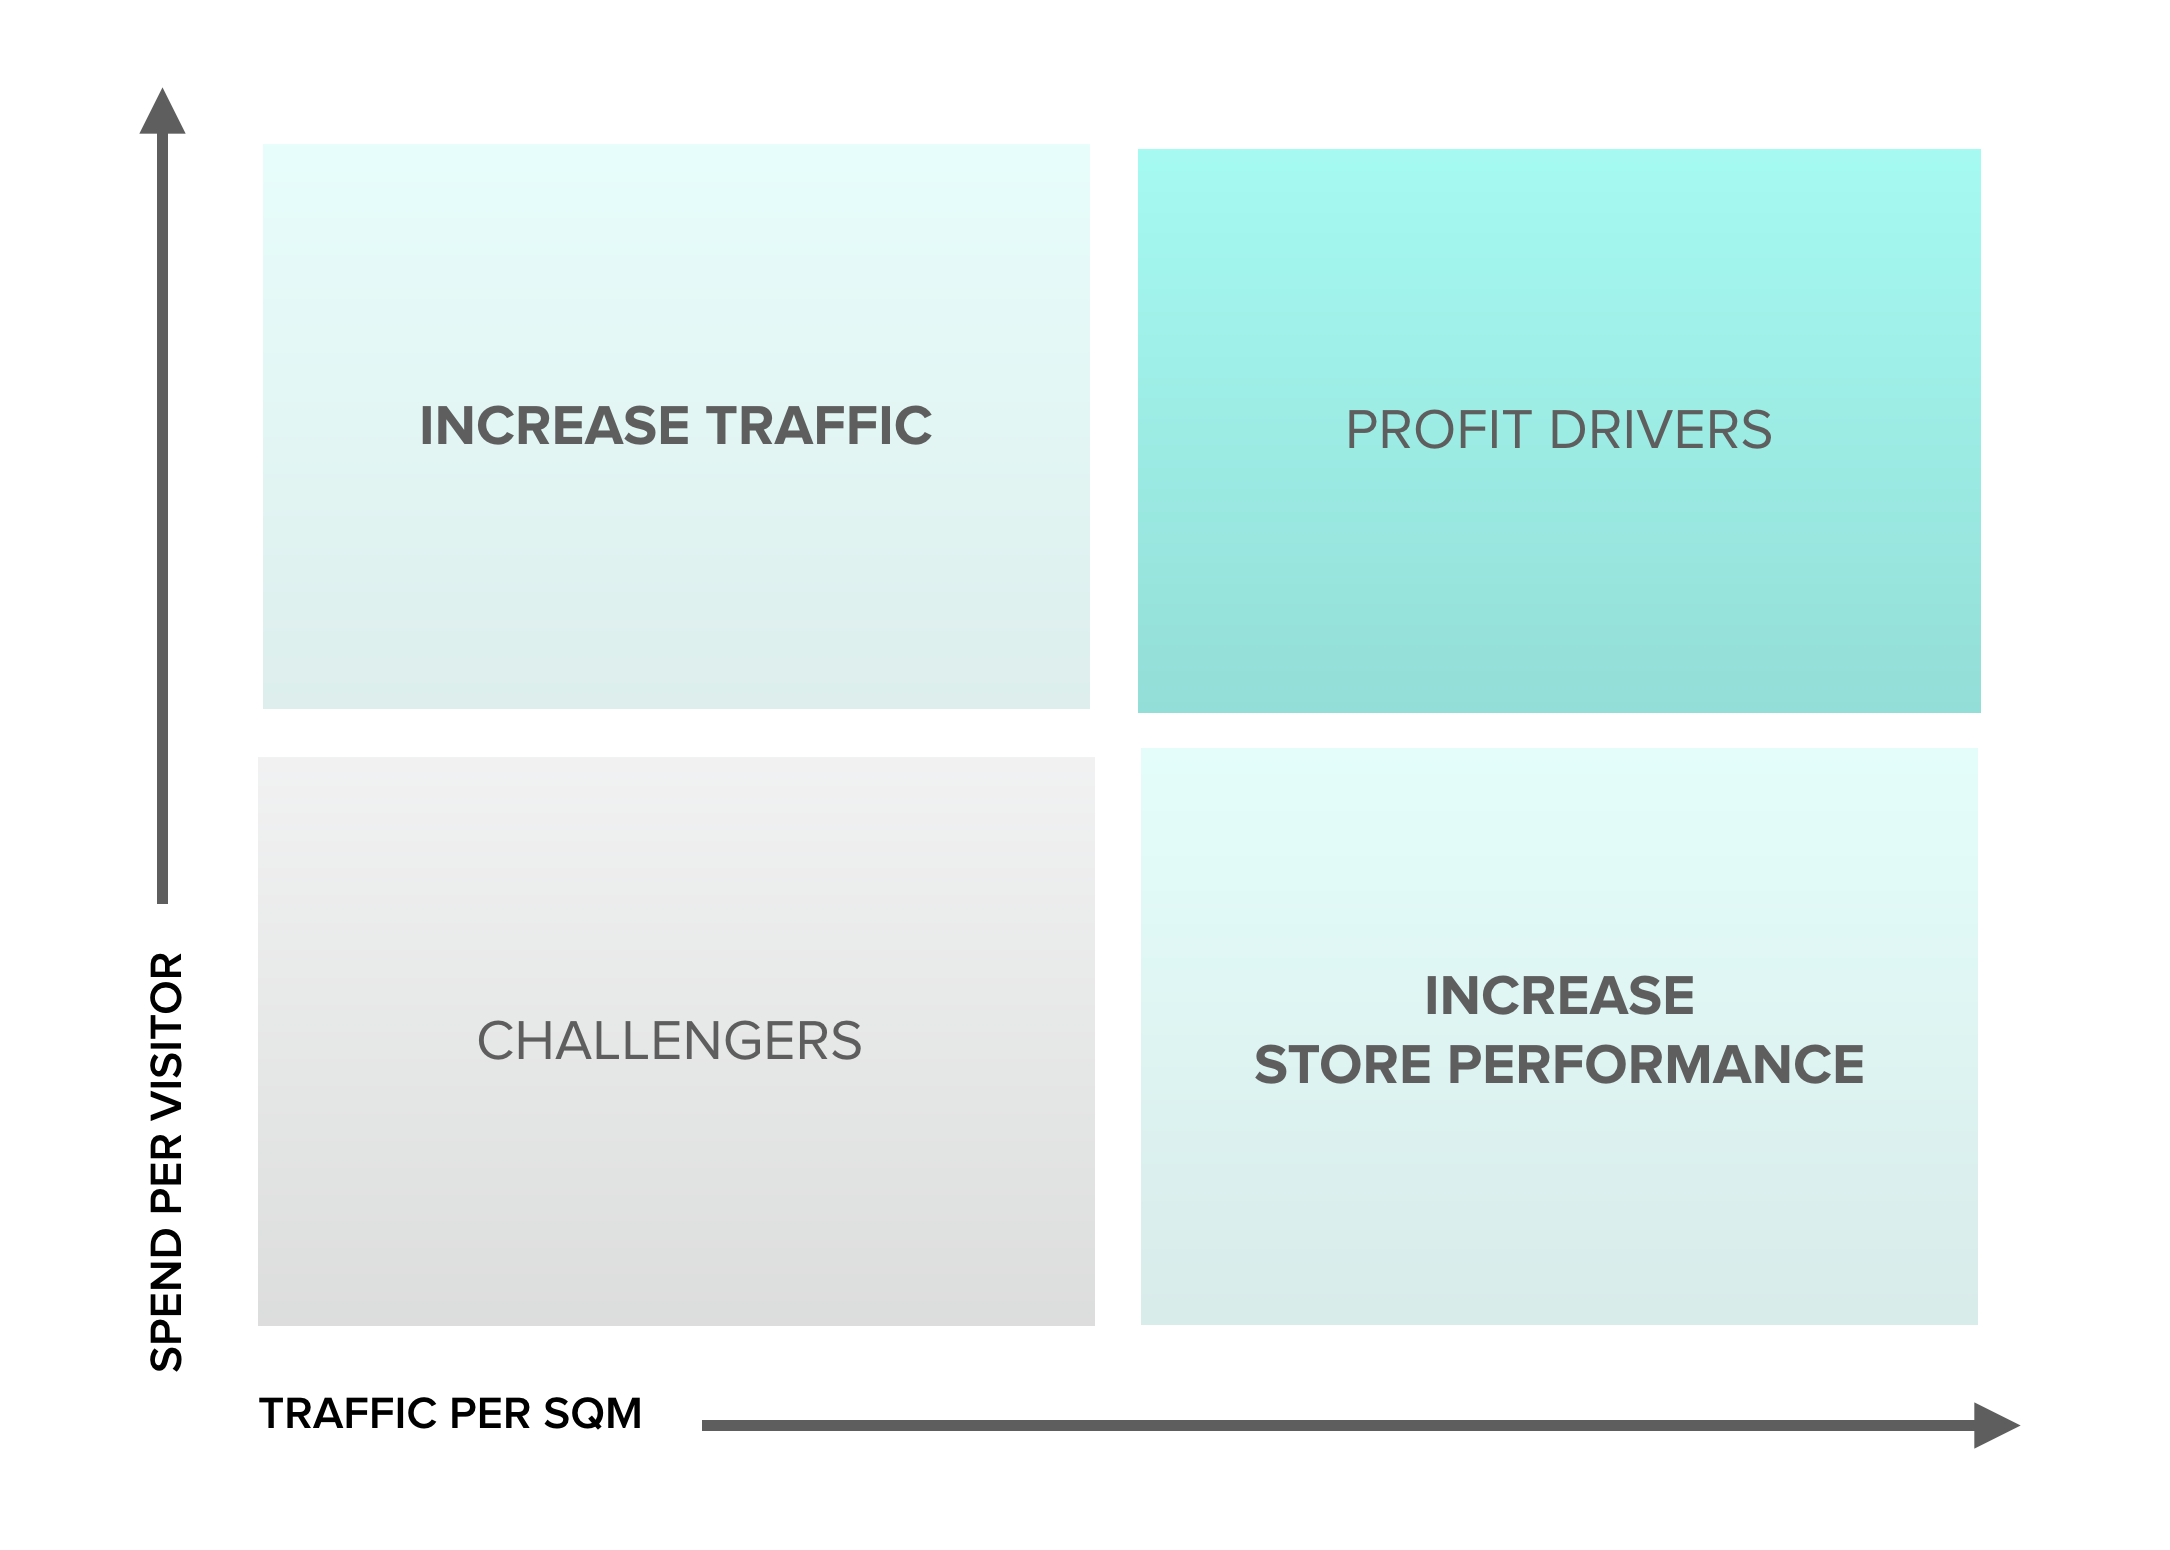
This is the first division of the Periodic system. The first, left part represents all of the Spend Elements, and the right part represents all of the elements which are driving traffic.
For instance, if we see that a store in London has good Spend indicators, which means that staff, assortment and space are aligned to convert the consumer to a customer, but we do lack relative traffic we should start thinking of optimising the shopping window to attract more visitors.
Vertically, the elements are grouped into Product and Presentation, Store and Product Services, Pricing, Staff and Service, Environment (all parts of the Key Spend Drivers) and Communication, Location Traffic(parts of the Traffic Drivers) and finally OmniChannel (which is driving both Spend and Traffic).
This System is adapted for the Clothing and Footwear vertical. However, there are specific food and automotive retail versions available on demand.
It is important to underline that this is not a treasure map and it can not work without the strong retail operations which could use it as the tool which could drive better decision making across the fleet with an intention to increase traffic and spend.
If you want to see case studies from Monolith’s retail performance labs, please send an email to office@monolith.co with your request.