As part of our series on the optimization of retail, for this session we’re focusing on improving product placement with StoreDNA, a practical and profitable technique every retailer should adopt to be ahead of the game.
To efficiently deliver a great shopping experience and increase in-store conversion rates, optimizing the assortment placement is of highest priority. When planning the assortment, understanding at what prime location retailers should place which products will undoubtedly affect how successful their sales are.
If you are ready to adopt agile assortment placement that naturally drives higher conversion rates, it is imminent to seek decision-ready insights based on your shopper’s in-store behavior. Once again, we sat down with Uroš Lekić from StoreDNA to hear how their platform helps optimise retail through product placement.
StoreDNA: Uroš, can you tell us about StoreDNA’s approach to product placement and methodologies which you are proposing?
Uroš: Be it a local florist, the nearby supermarket or a large department store in the city center, successful retailers have always been working to improve their displays and present merchandise in the most appealing way. Working with global retail leaders (Nike, Scotch & Soda, Lacoste, Samsung, Hunkemoller, Tory Burch and others), we have seen truly beautiful displays and learned from our clients’ strategies and concerns. While they by rule employ the best-in-class visual merchandisers, the prevailing and unanswered question remains if, after wowing the customer, those beautiful displays go on to optimally drive conversion, and how these efficiencies can best be quantified.
In the online world, e-commerce websites run a large number of digital analytics campaigns through which they continuously collect data on web page discovery, CTR and granular - item conversion points. In this way, they can drive improvements very accurately. We have developed an analogous, data-driven methodology for physical retail.
By analysing surveillance camera feeds through our proprietary computer vision algorithms, the StoreDNA Platform automatically collects valuable data on which parts of the store shoppers tend to stay longer, and which displayed items they interact with. We see this as their intention for purchase. When this data gets coupled to the actual sales of every of those items, our clients are able to understand conversion within the store - as opposed to traditional conversion at the door, and then act.
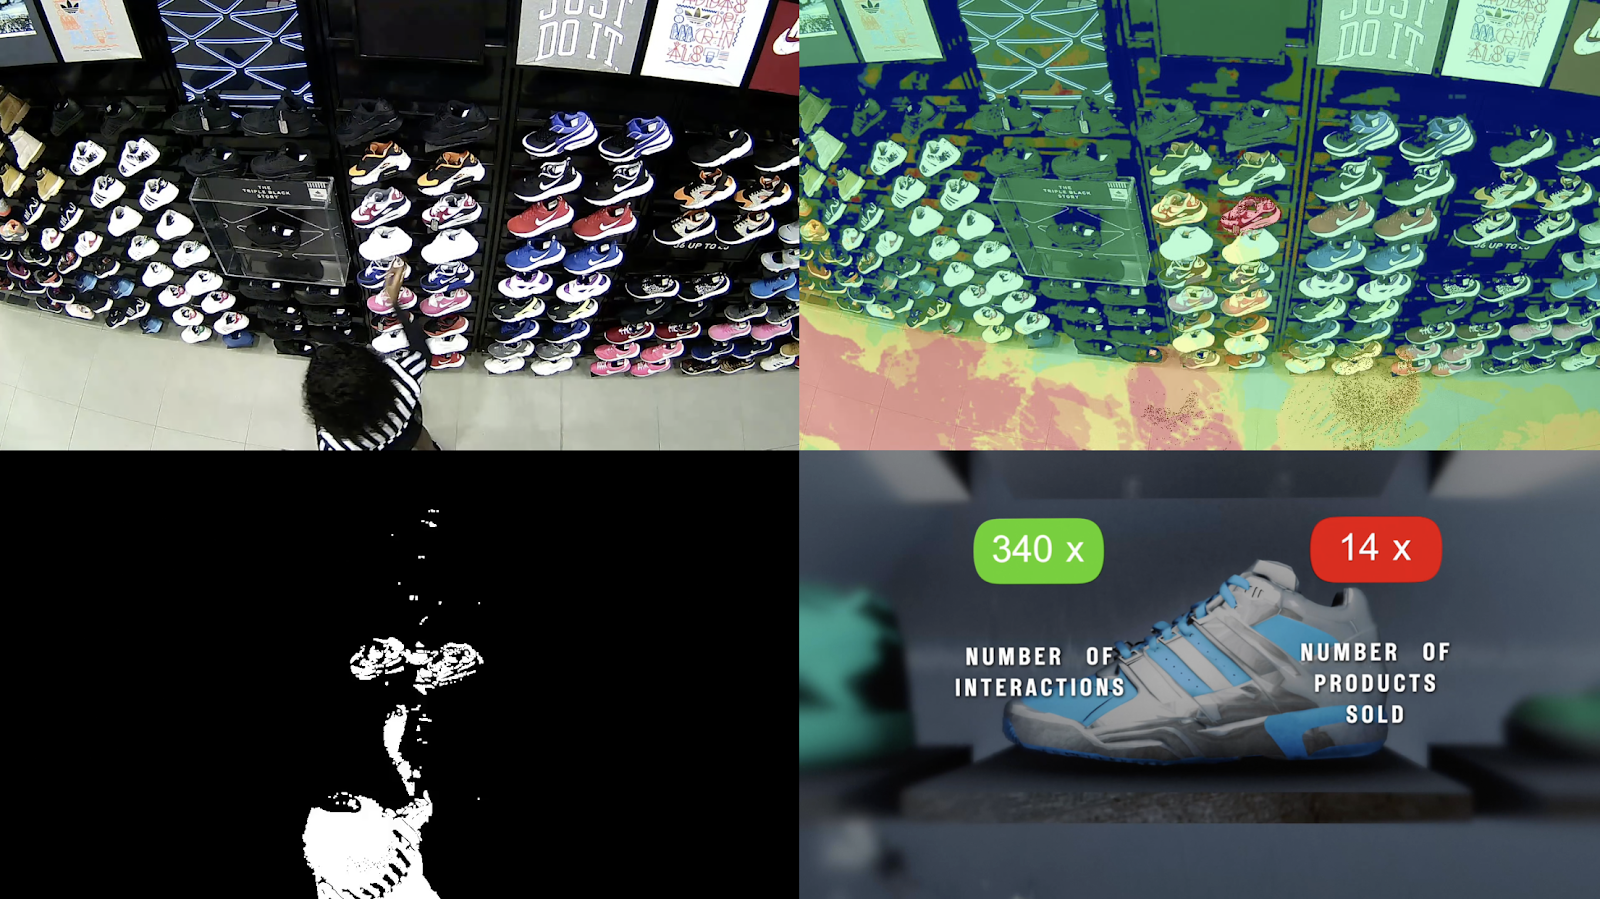
In this manner, retailers have an unbiased view on what shoppers look at and how much they engage with a specific item. As such, they can strategically determine where to place a product to drive sales. A poorly converting product placed in a high-traffic zone, for example, is a waste of prime shelfspace, and could be replaced with a high-converting product from a “cold” store zone.
StoreDNA: Not long ago, your clients meaningfully improved their product placement. Could you give us some examples and guide us through the process?
Uroš: Sure. The process always starts with as-is analysis, and collecting data over several weeks to understand how a store is used by the shoppers. Retailers will compare the findings to their expectations, and then hypothesise to understand the discrepancies. On those bases, they will introduce the changes which should bring improvements, and continue measuring engagement and sales over the next several weeks to learn from the effects. These campaigns can be repeated two or three times per year, typically at the onset of new seasons.
In the example below, the store has three sections, and our client was using the front room (far right, closest to the entrance), as the prime space to offer their newest collection and maximise its sales. Six weeks upon installing our platform, they revealed, however, that shoppers cumulatively spent the least time in that section, and used the front room as a “decompression zone”, before moving and more thoroughly exploring the rest of the store.
This retailer here tested by exchanging items between Fixture 1 from the first room (New Collection) and Fixture 4 from the second room (Classic Collection, iconics). The new concept was tested during 14 days. As a result of changes introduced in the product placement, they detected a 27% increase in cumulative sales of the repositioned items.
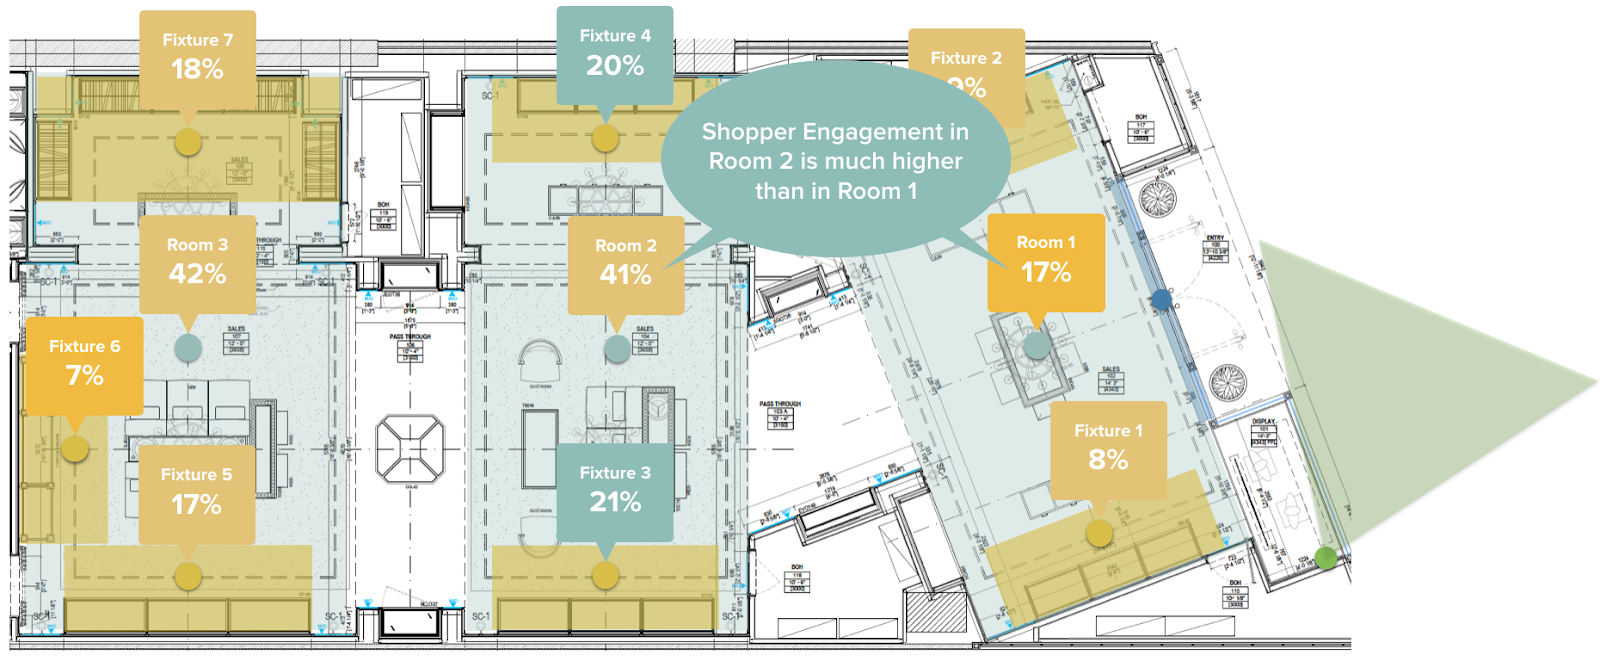
All three hypotheses were validated:
- Moving items from the New Collection to the higher engagement zone (Room 2) increased the sales of New Collection
- Moving items from the Classic Collection to Room 1 increased the engagement with this zone without a negative impact on sales (iconics are destination items)
- Product mix in Room 1, with Fixture 2 carrying the New Collection and Fixture 1 carrying the Classic Collection increased the engagement in Room 1 and sales. Moreover, the learning from only one store can be scaled to the rest of the brand’s retail network and deliver four-figure ROI’s.
StoreDNA: Are there more applications of the methodology?
Uroš: Certainly. An electronics retailer researched the engagement with their equipment during a promotional campaign for the release of a new generation of mobile phones.
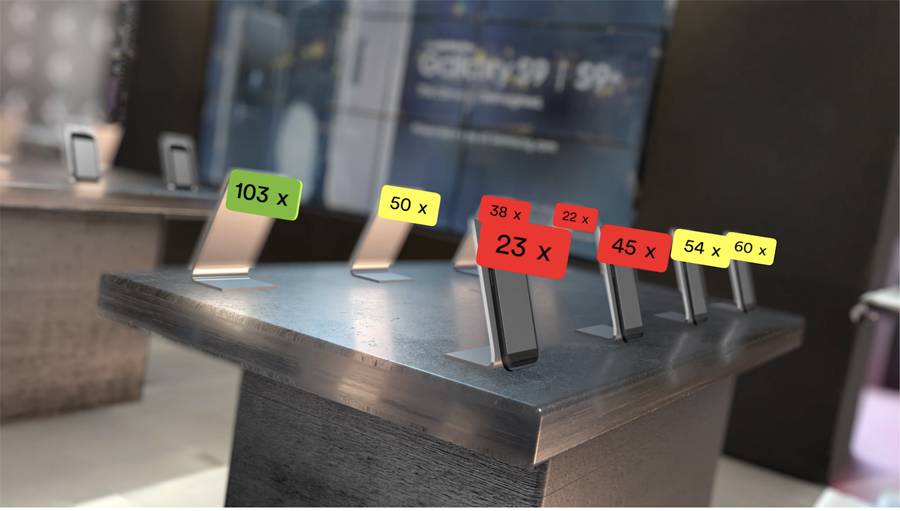
They learned which version of the phones is the most engaging in live interaction (size and color variants), and which wayfinding posts in the store drive the optimal shopper flow.
As their key objective, besides Visual Merchandising, StoreDNA offers decision-ready insights for the improvement of Staff Allocation, Storefront Design, and KPIs across all regions. Want to know more? Get in touch here.